Kick Off 2 in Stats and Graphs
Kick Off Online and Kick Off 2 fan site - by EternalStudent
A new scoring system - without explanation
I'm trying to create a new scoring method for KOOL!
If you don't want to read about the details, you can view my final effort here!
Score table
A new scoring system - explained
The current scoring system
Currently, player rankings in KOOL are calculated using the ELO rating system (with the addition of some small tweaks by Steve C).
This ELO system was originally invented as a method for scoring chess matches and ranking players, and is
designed to calculate the relative skill level between players (a full write up is on wikipedia); it effectively
works by awarding the winner of a game an amount of points based on the difference between the two player's rankings. The higher the rank the player you beat, the more points you get.
And the loser of course, gets the same amount of points taken away.
For the KOOL ratings, Steve C added a decay feature, which results in everyone's points slowly moving towards 1600 points. This was introduced to keep the player table fresh and to avoid a single player
remaining at the top for a long period of time.
The problems with the current system
The scoring system works quite well but falls down in some situations. These are some of the problems in my opinion..
Always playing the same player
The system works well if all players are playing each other regularly. However, if you are always playing the same 1 or 2 players over and over, your point tally will be heavily biased.
Cashing in on new players' points
Every new or returning player starts with 1600 points. If their skills are rusty, it leaves their points availble for some easy-picking by anyone playing at the time!
Life is hard at the bottom
The current system is poor at ranking the bottom half of the table.
If your score is below 1600 points, not only are you below the top ranking players, you have a group of inactive players (who's scores are moving towards 1600 points) separating you from the top group.
Also, if you play lots of players from the top half of the table, then you'll likely find yourself rooted to the bottom, even if you probably shouldn't be.
No difference between losing 14-0 and 6-5
Because the chess scoring system is based on whether you win or lose, it doesn't differentiate between a result that was quite close (eg. 2 - 1) or one that was a complete white wash (eg. 10 - 1).
A new scoring system - calculating the difference between players
I wanted to make a scoring system with the following attributes
- one that can quickly (from just 2 or 3 games) show you your current level and the players that play at a similar level
- a system where you don't "lose" points or have a negative amount of points
- scoring that takes in to account if the match was close or whether there was a big difference
- a calculation that equates a 3-1 win against the defensive player (eg. lockout) and a 9-3 win vs an attacking player (eg. 4-2-4)
- one that takes in to account that some players go easy on their opponent in a match if they have a big lead
- limit the amount of points you can take from one player, particularly in a single match
This isn't really rocket science. You'd expect that better players will score more goals against you than you score against them, right? So my idea is to base a new scoring system on something similar to this Ratio score
One of the problems of using just a basic ratio score like this is that the calculated values give an exponentially skewed score. The loser's score will be between 0 and 1, while the winners score (grows exponentially above 1).
For example;
a match ending 4 - 2, the ratio is (2/4=) 0.5 for the loser and (4/2=) 2 for the winner.
a match ending 5 - 2, the ratio is (2/5=) 0.4 for the loser and (5/2=) 2.5 for the winner.
We need a better type of ratio score! There are a few different ways of calculating ratio scores
I think a normalised ratio score gives a nice way of standardising a result like this;
|
this is the same as "the difference in goals scored" divided by "the total number of goals scored" | → |
|
The result of this forumula is a normalised goal difference score.
Using the previous score example;
a match ending 4 - 2, the ratio is ((2-4)/(2+4)=) -0.33 for the loser and ((4-2)/(4+2)=) +0.33 for the winner.
a match ending 5 - 2, the ratio is ((2-5)/(2+5)=) -0.43 for the loser and ((5-2)/(5+2)=) +0.43 for the winner.
One advantage of this normalisation is that it equates a small win/loss against a defensive player and a large win/loss against an attacking player
For example,
a match ending 4 - 2, the ratio is ((2-4)/(2+4)=) -0.33 for the loser and ((4-2)/(4+2)=) +0.33 for the winner.
a match ending 8 - 4, the ratio is ((4-8)/(4+8)=) -0.33 for the loser and ((8-4)/(8+4)=) +0.33 for the winner.
Using this method for all players that have played at least one game against each other, we can calculate a score for each player-vs-player pairing. But before that, lets add a few
more rules to keep things fresh and clean!
Average the score over the last 3 games
To avoid a single match completely changing the score between two players, the calculated goal difference should be based on the last 3 matches.
This will allow a good recent-form comparison without one single match result having too large an influence on the final calculation.
Include only players who have played in the last 3 months
Scoring should only be calculated for those players that have played a game within the last 3 months.
Limiting the points against a single opponent in a match
I personaly find that, if I get ahead in a match by between 2 and 3 times the number of goals, I reduce the competitive pressure.
I think the amount of points a player can score against one person in one match should be limited.
Hopefully this will discourage the complete annihilation of newbies. We can include a min/max limit of -0.5 to +0.5 to the ratio score calculation.
(a ratio score of 0.5 is equivalent to scoring 3x the amount of goals.)
For example,
a match ending 3 - 1, the ratio is ((1-3)/(1+3)=) -0.5 for the loser and ((3-1)/(3+1)=) +0.5 for the winner.
a match ending 9 - 3, the ratio is ((3-9)/(3+9)=) -0.5 for the loser and ((9-3)/(9+3)=) +0.5 for the winner.
No one likes a negative score
Rather than have a min/max score of -0.5 to +0.5 we can simply add +0.5 to the calculated score
which will give a final score range of 0 to 1. This has this nice side effect that, you will still score at least some points from a match
if you can keep the amount of opposing goals to less than 3x the amount of yours.
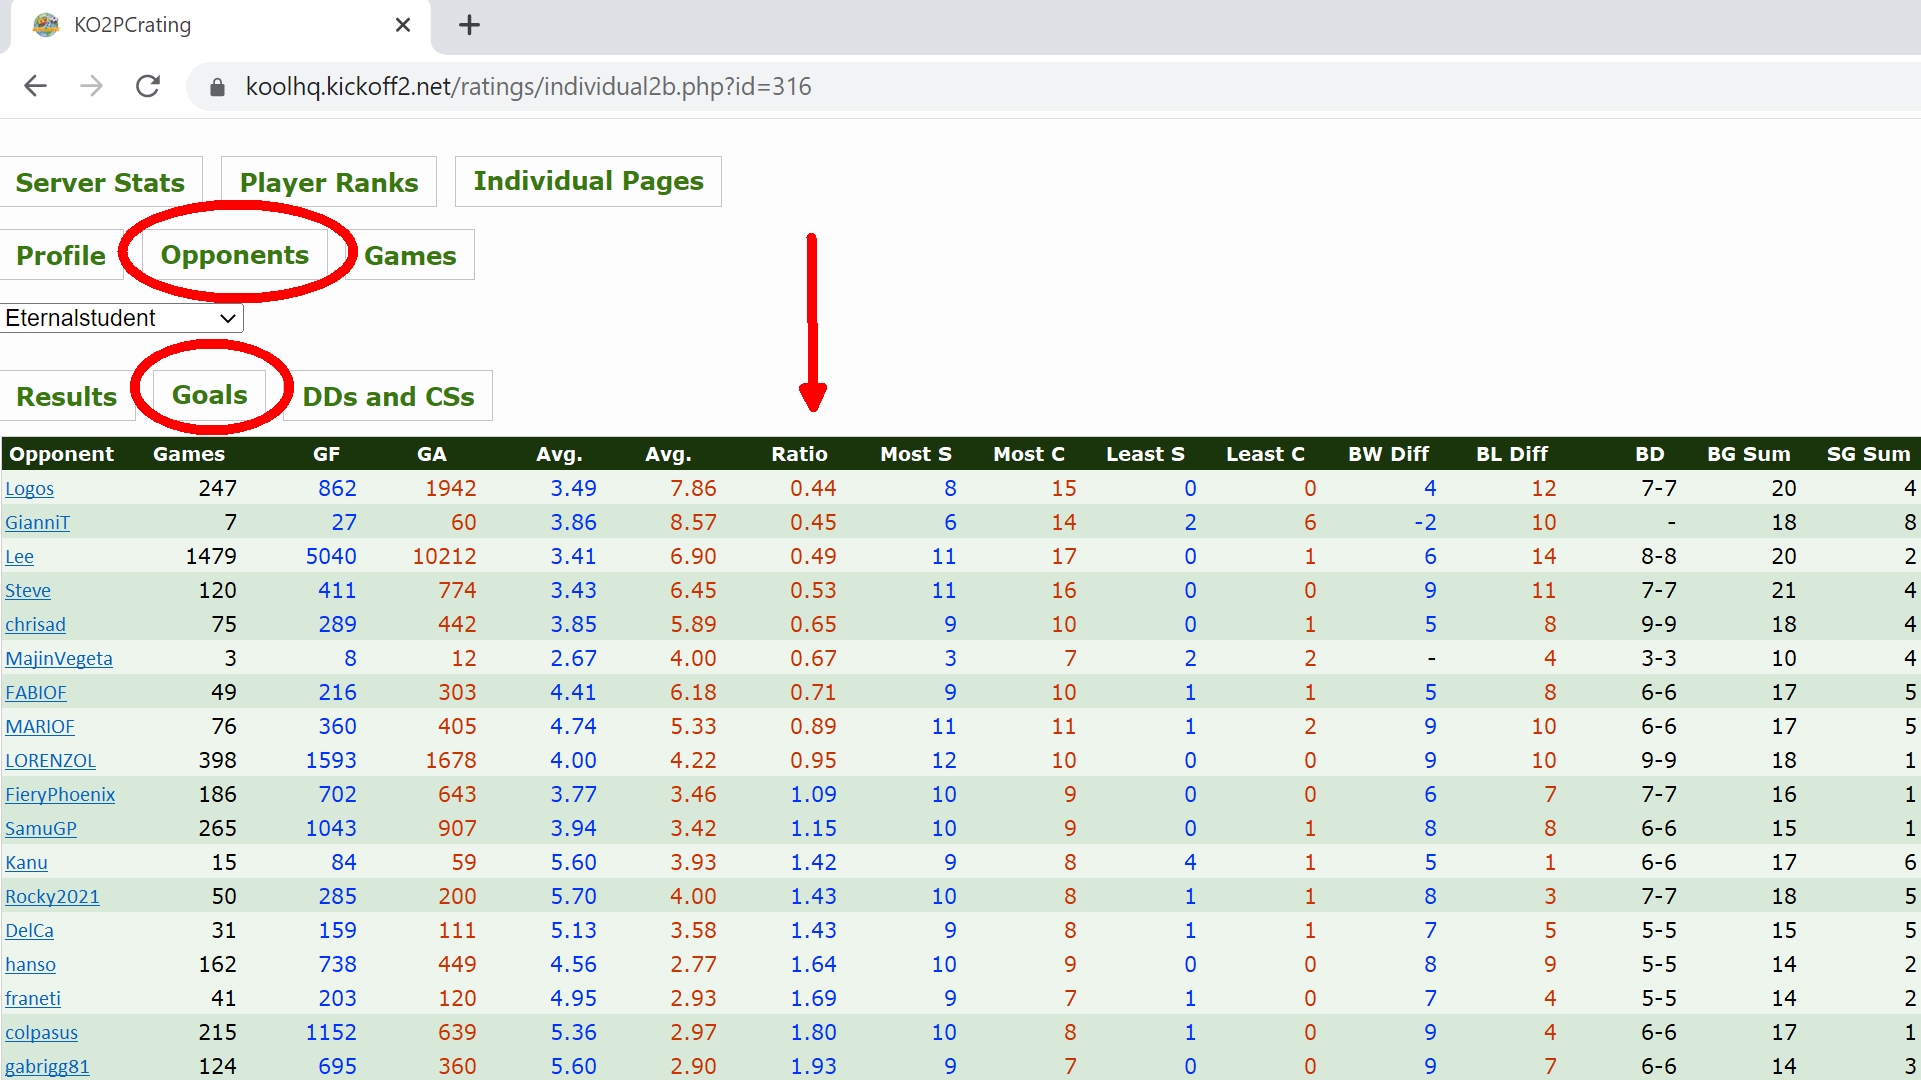
Ok, if you're still with me so far! Taking all of the above considerations in to account, this is the table you get!
Score table - calculated values
This is looking good! However, as you can see there are a lot of gaps.
Now we have to try and estimate the scores between players that haven't played each other..
A new scoring system - estimating the difference between players
Estimate the difference between two playersIf two players haven't played each other, a relative score can be calculated by comparing their scores against a common opponent. There is some guess work involved here and an assumption that the scoring system described above is an absolute and linear measure of relative skill (which it probably isn't but might be close!)
Take for example (at the time of writing), colpasus and franeti. They haven't played a game against each other in the last 3 months. But they have played plenty of players in common.
(they have both played Eternalstudent, FieryPhoenix, gavthomas, geo4444, Logos, RebelDanny, Rocky2021, SamuGP and Steve)
Taking one of these common opponents, the lob master Steve, the scores for colpasus and franeti against Steve are
colpasus has a score of 0.37 against Steve (and the reverse score Steve vs colpasus is 0.63)
franeti has a score of 0.26 against Steve (and the reverse score Steve vs franeti is 0.74)
We can subtract the two scores against Steve to obtain an estimated difference score for colpasus vs franeti of 0.22.
But before we do that, lets first set a rule to help improve the quality of the estimate.
Use matches from the last year to do the estimation
To ensure an accurate level of estimation we can use all the results as far back as 1 year.
Calculating the difference using a common opponent
In this example below, the diagram shows colpasus' and franeti's calculated ratings against Steve. colpasus has a closer/better rating to Steve than franeti does. Subtracting the colpasus-Steve difference from the franeti-Steve score, you get an estimated difference of 0.22.
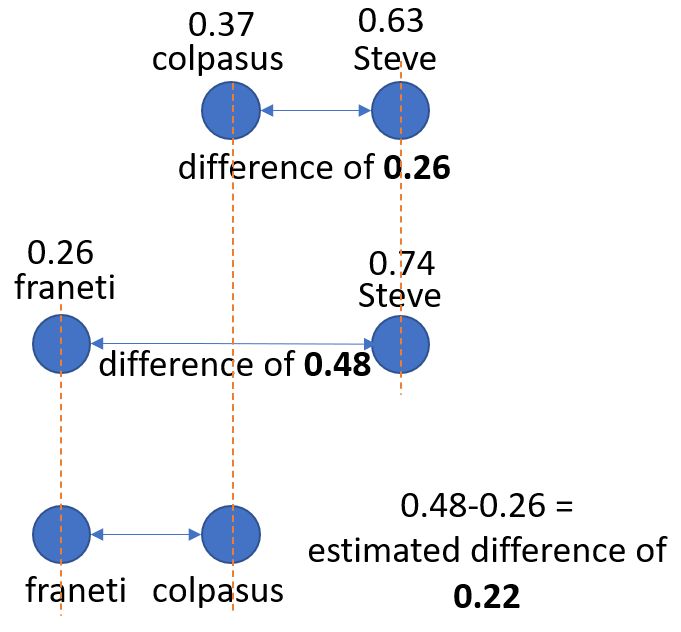
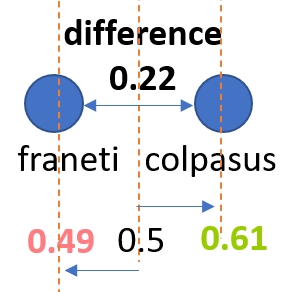
To align this result to the other calculated scores above you need to divide the difference score by 2 and add +0.5 This gives you a final estimated score for the table.
colpasus' score vs franeti = 0.61
franeti's score vs colpasus = 0.49
Now we have a good way to estimate a score between players that haven't played, lets finalise the last set of rules to improve this estimation.
Weight the connected players with more matches in common
In the above colpasus-vs-franeti example we have only used a single opponent to estiamte the score. To improve the estimate we can take all of the matches with common opponents and average the scores. Then, score comparisons with many games are given a stronger weighting than score comparisons based on only a few games.
To demonstrate using a made up example..
Trying to find an estimated score for colpasus vs franeti
colpasus vs Steve have played 4 times and have a score of 0.5 (ie. they have the same goal difference over the 4 matches)
franeti vs Steve have played 1 time and have a score of 0.4
This would give colpasus vs franeti an estimated score of 0.6 ((0.5 - 0.4)+0.5)
we can only give this score a weight of 1 as the franeti vs Steve calculated score is based on just a single game.
Then if we look at another common opponent
colpasus vs FieryPhoenix have played 15 times and have a score of 0.3
franeti vs FieryPhoenix have played 10 times and have a score of 0.1
This gives a colpasus vs franeti estimated score of 0.7 ((0.3 - 0.1)+0.5)
we can give this score a weight of 10 as it is based on at least the 10 game calculated score between franeti and FieryPhoenix.
Averaging these two estimated scores with their weighting gives the following calculation for the final estimate
|
= |
|
The final estimate is "pulled" more towards the FieryPhoenix rating than the Steve rating as it is based on more games in common.
And finally, we need to make sure all the players in the list are well connected to the other players. In some cases, it is still possible to have a player that doesn't have many players in common to calculate the estimated score (most likely because they've only just started, or they have only played one single opponent). There are two methods for filtering low connected players (apart from the above rule of only including players that have played matched within the last 3 months)
Remove any player that hasn't played many players
To be included in the table you need to have played at least 10% of the player base or a minimum of 3 players, which ever is the smallest number. This rule will allow for calculating scores in the early days of KOOL when there were only 6 or 7 players (at the moment the table only shows todays calculated scores but a future update should enable you to go back to different time points). Generally, over the last 2 or 3 years, there has been at least 20 or 30 active players over any 3 month period (therefore in practice the minimum requirement is to have played at least 2 or 3 players.)
Mark any low-connected players that are still remaining If there are any players that have a final total score based on a reduced number of connected players (ie. if it's not possible to calculate a predicted score against all of the other players), the score will appear greyed out. The low connected players have been left in as they are likely to be newcomers or players that haven't played in a while (coming up to 3 months). Being in the list will allow newbies to get a quick sense of which players play at a similar level to them. A low connected player is defined (currently) as a player that has fewer than 90% connections to the current player base or fewer than 3 connections, which ever is smaller.
And for the final step!
Standardise the scores To be able to compare scores from different points in time where there are different numbers of players, the final total score needs to be standardised! This helps to keep the points distribution between 0-1000 independent of the number of current players. This can be done by dividing the number of comparisons with the total number of players and then multiplying the result by 1000. This means, for example, if you are scoring 80% of the points against all the opponents, and then 10 more players come along and you're still scoring 80% of the points, your standardised score will be the same.
The Final Scoring Table
Taking in to consideration all of the above calculations, you finally reach the final scoring table!
Score table
A new scoring system - validation - estimating the difference between players
This part is a bit mathematical and is an attempt to validate the method used for estimating scores. To check whether the proposed estimation scoring method is accurate, we can take all the player-vs-player calculated scores and also calculate an estimated score for the same pairing using the scoring method described above. You can then graph this data and fit a straight line through it to show how close the estimated scores are to the calculated scores.If the estimated score was an exact prediction of the calculated score, you would expect all of the graphed points to fall on a diagonal line (where x=y) and the line to have a slope value of 1 (for example, if you had a calculated score of 0.5 against one player, you would also have a calculated score of 0.5 and similarly, if you had calculated score of 1 you would expect an estimated score of 1 too). You would also expect the line to pass through x=0, y=0 and therefor have a y-intercept of 0. One more statistical calculation for this type of data is the coefficient of determination (R2) which is a measure of how well the data fit the line (so how closely the points fit on a line); for a perfect fit R2 would equal 1 and for a none correlated set of data the fit would be 0.
The following image shows all of this data; all player-vs-player calculated scores (x) against their estimate scores (y) based on matches against common opponents.

Each point represents the calculated score and the estimated score for each player pairing.
With all the data together, the slope is 0.82 and the y-intecept is 0.09. The coefficient of determination (R2) value is 0.77.
These results show that the estimated scores are reasonably close to the calculated scores.
However, you can see from the graph that a lot of data points are located at the extreme values (calculated score -0.5 and 1.5). These are generally comparisons based on 1 or 2 games where one player hasn't scored any goals. We can clean up the data by only using values from player pairings where they have played many games against each other. The 2nd graph shows the same data (estimated vs calculated data) with only those player pairings with at least 40 games against each other.
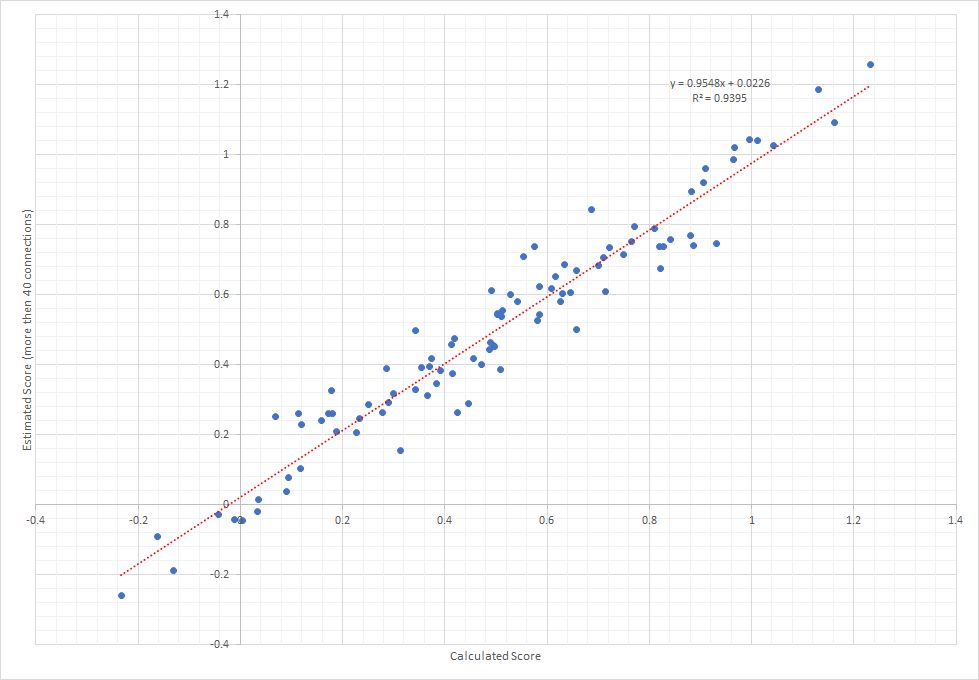
Using the cleaned data points, the slope becomes 0.95 and the y-intecept 0.02. The coefficient of determination (R2) is 0.94. With a high coefficient of determination, and a y-intercept close to zero and a slope very close to 1, it would suggest the proposed estimated scoring method is relatively accurate!
Let me know what you think of the new scoring system! If you have any suggestions or improvements, please let me know!